





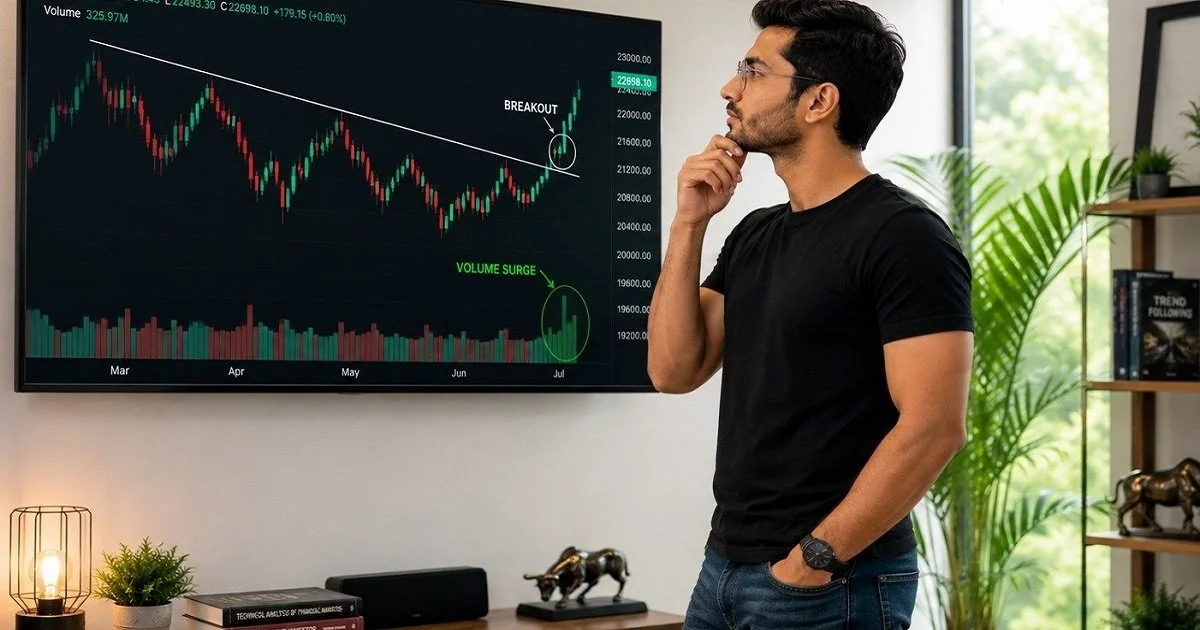
After the primary selection of the stocks, I draw a trendline connecting the recent lower highs on a daily chart and wait to see if the price closes above it. That trendline break is an important signal, but not enough for me to act on by itself. Many trendline breaks turn out to be traps.
Step 4 of my process is the most important: confirming the breakout with volume. Without this step, I would be relying on hope to make trades. With it, I’m trading on evidence.
Why a Trendline Break Alone Isn’t Enough
The problem with just reacting to a trendline break is that price can poke above a trendline for a dozen reasons that have nothing to do with a real trend change. A single large buyer, a short squeeze, or an overreaction to minor news can all push the price above a line on the chart, even if there is no real, broad-based trading interest behind it. That’s what I call a “false breakout.” It’s one of the most frequent pitfalls that traders encounter.
What separates a breakout worth acting on from one worth ignoring is almost always the same thing: who showed up when it happened. And the way I measure that is by volume.
What Volume Actually Is
Volume is just the number of shares of a stock that changed hands over a specific time frame. In my case, I am referring to a single trading day, as I am working on the daily time frame. Every chart I see has a volume bar sitting underneath the price candles, and it is just as important as the price action itself.
Here’s why volume is so important: it shows how much conviction was behind the price action. A stock can close up 2% on a quiet day when almost no one is trading it, or it can close up 2% on a day when trading activity exploded compared to every session before it. Those are two entirely unique signals, even if the price chart looks similar at first glance.
| What You See | Low Volume | High Volume |
| Price breaks above trendline | Weak, easily reversed, treat with suspicion | Strong, broad participation, worth taking seriously |
| Price holds steady | Quiet consolidation, low conviction either way | Meaningful accumulation or distribution happening |
| Price falls | Minor profit-taking, not necessarily a trend change | Real selling pressure; respect the move |
Volume Must Exceed the Previous Candle
I keep this rule simple and non-negotiable. When the price breaks above the trendline, the volume on that breakout candle must be higher than the volume on the candle immediately before it.
I’m not looking for average volume or just a notch above average. I want to see a spike, a bar that is clearly taller than the one next to it. That jump shows new participants are entering the stock at the breakout, not just the same handful of traders moving the same shares around.
If the breakout candle’s volume is flat, lower, or barely different from the prior candle, I don’t trust the move yet. I let the stock sit on my watchlist and wait for a cleaner signal instead of forcing a trade on a technically true-but-weak breakout.
A Real Example: Trendline Breakout
Here’s the same Maruti setup from Step 3, taken a step further.

After weeks of price action remaining below the downward-sloping trendline that connected its lower highs, Maruti’s price finally broke above that line. If you look at the volume bars underneath, you can see that the breakout candle is clearly visible; it is much taller than all the volume bars from the several sessions before it. That’s the kind of confirmation I want, price and volume confirming each other at the same time.
This moment is where the setup becomes ‘actionable’ rather than just ‘noteworthy’ in my process. The trendline gave me the signal; the volume gave me the belief.
Trendline Break vs. Confirmed Breakout
| Scenario | Trendline Broken? | Volume Higher Than Previous Candle? | Observation |
| Price pokes above the line on quiet volume | Yes | No | Likely false breakout; wait |
| The price closes above the line with a volume spike | Yes | Yes | Confirmed breakout; move forward |
| The price stays below the line entirely | No | — | Downtrend intact; no action |
| Price breaks the line but immediately reverses back below it | Briefly | Irrelevant | Failed breakout: discard, don’t chase |
Final Thought
A confirmed breakout with substantial volume is a strong indicator, but it does not serve as my entry signal. In the next article, I will go into detail about the next steps, explaining why I wait for the price to actually form a higher high after the breakout and why I refuse to enter.
If there’s one habit I’d pass on from this step alone, it’s this rule: never trust a breakout you haven’t checked the volume on. The price can lie for a day or two. The volume rarely does.
Find out here: Waiting for the Higher High: My Final Condition Before I Take a Position
Disclaimer: This column reflects the author’s personal trading experience and analysis. It is not financial advice. Please consult a registered advisor before making any investment decisions.

Satyajit Baidya
He is an option writer who came to the markets through curiosity and stayed through conviction. He studies price action through the lens of Elliott Wave theory and draws his trading philosophy from Jesse Livermore—the belief that discipline, timing, and patience matter more than predictions do. A student of history by training, he sees the market as just another chapter in a very long story: the details change, the patterns don’t.


