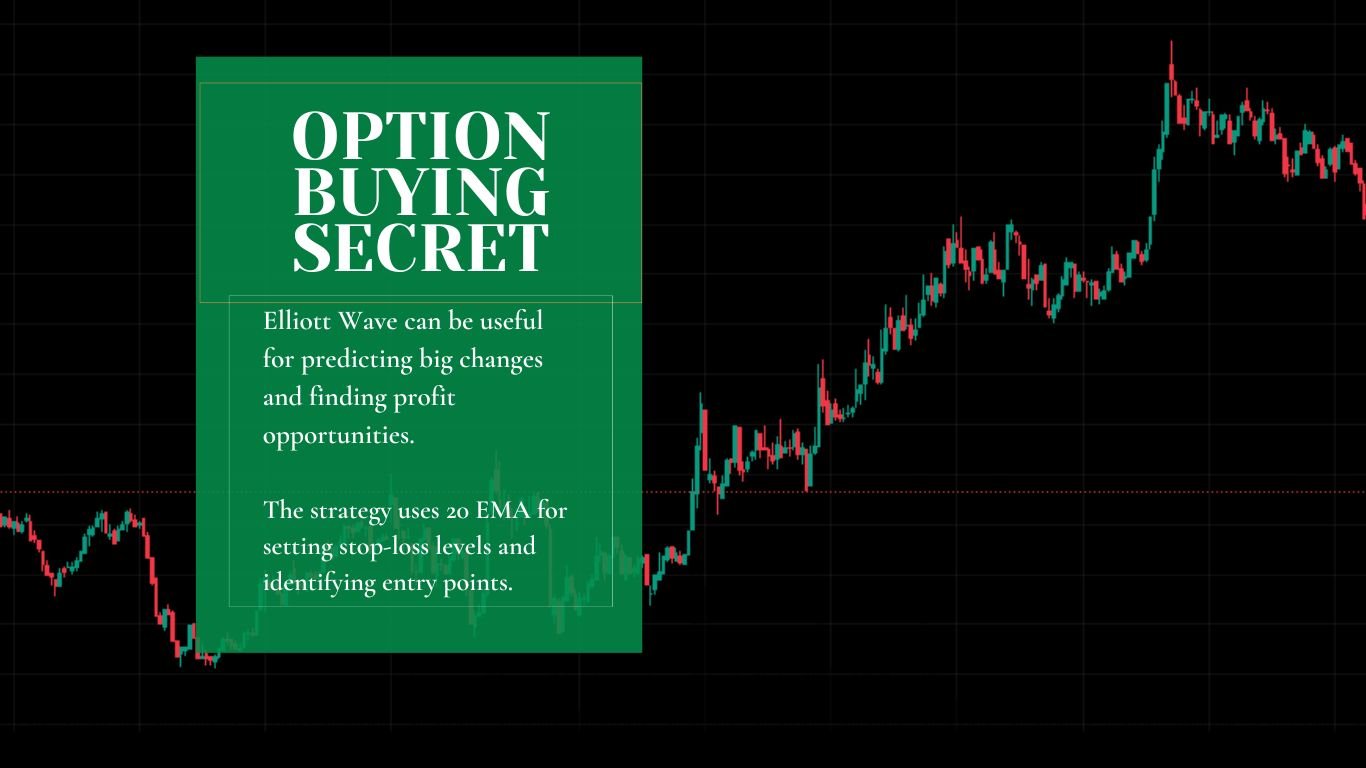
Market Behavior
Observing a price chart from a distance reveals that price movements are primarily of two types. The market exhibits two types of waves, according to Elliott Wave theory:
1. Motive Wave (Trend)
Characteristics: Price rally is strong and quick, with increasing volume.
Behavior: Indicates a clear trend in one direction, which is frequently followed by major price movement.
2. Corrective Wave (Correction)
Characteristics: Price moves that are overlapping, limited volume, and slow price action.
Behavior: After a sustained price rally, the market enters a corrective phase in which it corrects or retraces a portion of the prior trend.
In short

How Many Types of Wave
The Elliott Wave Principle, key to market behavior, distinguishes two fundamental wave patterns. Motive waves are characterized by strong trends with quick price movements, indicating clear directional momentum. Corrective waves, on the other hand, reflect corrective phases with slower, overlapping price actions following a significant price rally.
Elliott Wave Chart Pattern
How Do You Read The Elliott Wave Chart?
If you observe the price chart of any financial instrument (stock, future, option, commodity, currency, etc.), you’ll see two separate phases, one directional and one corrective, which alternate sequentially. When you see overlapping price actions on the chart, be patient and consider profit-taking.

The overlapping and slow price activity could indicate an impending motivation phase, giving it a profit-taking chance. It’s important to note that, according to wave theory, the majority of market time is spent in corrections, requiring traders to wait patiently for chances to profit after a long period of time.
How to Identify (Wave)?
To identify the end of a correction and signal the next motive phase, observe the completion of the three waves in the correction: A, B, and C. Notably, Wave C, the last correction phase, is made up of 5 sub-waves. Recognizing the completion of Wave C provides a crucial clue for forecasting the start of the next Motive phase, especially in determining entry into the market.

After the correction, the motive wave begins, with a steady price movement in waves 1 through 5. The price change in Wave 3 is rapid, accompanied by an increase in trading volume. Due to favorable trading conditions, traders may experience a honeymoon period during Wave 3.
What are the characteristics of the Elliott Wave?
Waves 1 through 5 of the motive wave advance in the direction of the prevailing trend. Wave 3 is often referred to as the motive wave’s heart because it is the most energetic and may be extended.

Following the motive wave, a correction phase with three waves known as A, B, and C occurs. Wave A moves against the trend, Wave B corrects, and Wave C returns to the trend, which is often the most powerful of the corrective sub-waves. The natural rhythm of market cycles, as explained by Elliott Wave theory, is captured by this alternating pattern.
Motive Wave
In the context of Elliott Wave theory, a Motive Wave is a five-wave pattern that represents the directional movement of a market trend. Waves 1 through 5 advances in the direction of the strong trend, while Waves 2 and 4 are corrective. This organized pattern provides insight into the mechanisms of trend development in financial markets.
Corrective Wave
A Corrective Wave is a three-wave pattern noted for its function in retracement and consolidation within a market trend. This corrective pattern, labelled A, B, and C, develops after a motive wave. Wave A moves against the trend, Wave B corrects, and Wave C is the most powerful, frequently continuing the dominant trend. Understanding Elliott Wave Corrective Patterns is crucial for traders because it helps identify potential reversal points or opportunities for strategic market entry.
Wave Theory
Ralph Nelson Elliott developed Elliott Wave Theory, a crucial component of technical analysis, in the 1930s. According to this idea, market movements follow repeating patterns symbolized by waves.

Markets change in cycles of optimism and pessimism, developing motive waves and corrective waves. These patterns, which are designated numerically and alphabetically, assist traders in anticipating future market moves and identifying potential entry and exit opportunities. R.N. Elliott’s seminal work has since become a cornerstone of technical analysis, providing significant insights into market behavior and trend formation.
Final thoughts
This is our view just for information and education purpose only. Have you ever attempted to apply Elliott Wave patterns? What do you think? How effective is the Wave Theory in the field of investment? Feel free to share your opinions in the comment box below.
FAQs
What are the patterns of the Elliott wave?
The Elliott Wave Theory categorizes financial market patterns into impulsive and corrective waves. Impulse waves, represented by numbers 1, 2, 3, and 5, indicate the main trend direction. Corrective waves, labeled A, B, and C, represent countertrend movements and alleviate extreme price movements. Common patterns in corrective waves include zigzags, flats, and triangles.
Is Elliott Wave accurate?
Elliott Wave analysis can be accurate when applied skillfully by experienced traders, allowing them to make predictions about potential price movements and trend reversals. However, successful application often requires a combination of technical analysis, risk management, and understanding of market conditions. Many traders incorporate Elliott Wave analysis into a broader toolkit, acknowledging that no single method guarantees accuracy in complex financial markets.


