






When the MACD divergence shows that the price movement and the MACD indicator don’t match up, it means that the current trend might not be strong. The histogram is a good way to figure out who is in charge of the market. To trade MACD divergences successfully, you need to find divergences, wait for signal bars, set stop losses, and try to take profits close to support and resistance levels.
If you’re interested in learning how professional traders identify market reversals before they occur, you’ve come to the right place. The most important sign is often MACD divergence. This article will teach you how to confidently find, understand, and trade MACD divergence. In the end, you’ll know how to use this powerful tool to keep your money safe and get in on big market moves before most people do.
MACD Divergence and Convergence
Looking for changes in market momentum? The Moving Average Convergence Divergence (MACD) indicator is one of the best ways to find them. It is made up of three main parts:
- MACD Line—the difference between two moving averages that grow exponentially (usually 12 and 26).
- Signal Line—a 9-period EMA of the MACD line.
- MACD histogram—tells you how far away the MACD is from the signal line.
When the MACD line separates from the signal line, this phenomenon is referred to as divergence. Conversely, when the MACD line approaches the signal line, it is called convergence.
That would be a bearish divergence if you looked at a stock chart and saw that prices were setting new highs while the MACD histogram was setting lower highs. It lets you know that momentum is fading and that a change could be coming soon.
Price drops while the MACD histogram goes up; that’s called a bullish divergence and could mean that the market has reached its bottom.
What Is MACD Divergence?
When the price of an asset moves in a way that doesn’t match the direction of the MACD indicator, this is called MACD divergence. There is a “disagreement” that the current trend might not be as strong as it feels.
- If the price goes up and the MACD doesn’t follow, this is called bearish divergence.
- When prices drop while the MACD goes up, this is known as bullish divergence.
This happens because MACD looks at momentum as well as price. When a price hits a new high but momentum doesn’t back it up, that’s either a warning sign or, if you’re a smart trader, a possible chance.
MACD Divergence Explained
The MACD histogram is your secret weapon for finding out whether bulls or bears are in charge of the market.
Here’s how you read it:
- If the most recent MACD bar is higher (or less deep) than the last one, it means that bulls are in charge.
- If it’s deeper (or less high), it indicates that bears are in control.
Now, pay close attention to the right edge of your chart. The last two bars of the MACD histogram tell you who is winning right now.
These are standard signals; however, the most reliable signals arise from divergences—situations where the price and the MACD move in opposite directions.

Bullish MACD Divergence
A bullish divergence happens when:
- Price makes a new low;
- The MACD-Histogram forms a higher low; and
- The MACD crosses above zero between those two lows.
The zero-line break in the middle is very important. Without it, there isn’t any real difference.
On the BTCUSD weekly chart (above), let’s say that November 2021 was the first time the market fell. After that, in April 2022, the MACD histogram went up above the zero line. However, MACD showed a shallower bottom, which showed that the bears were wearing out. In November 2022, the price hit a new low.
In March 2023, when MACD went up, that meant you should buy. It was the start of a new bull run.
You don’t need to wait for MACD to go back above zero. As soon as the histogram stops going down and shows a less negative bar than before, it’s time to buy.
Bearish MACD Divergence
When a bearish divergence shows up near the market high, it means that bad things are about to happen.
It happens when:
- Price makes a high,
- Pulls back,
- Then makes a higher high, while the MACD histogram makes a lower high.
The MACD histogram goes below the zero line during the drop from the first peak. The histogram goes up again when the price hits its second high, but not by as much this time.
This chart is your warning: bulls are losing power, and prices are only going up because they have to.
As a general rule, you should wait for the MACD histogram to tick down from its second, lower peak before going short. You need to be patient. The price goes up quickly, and many traders get excited and get in early.
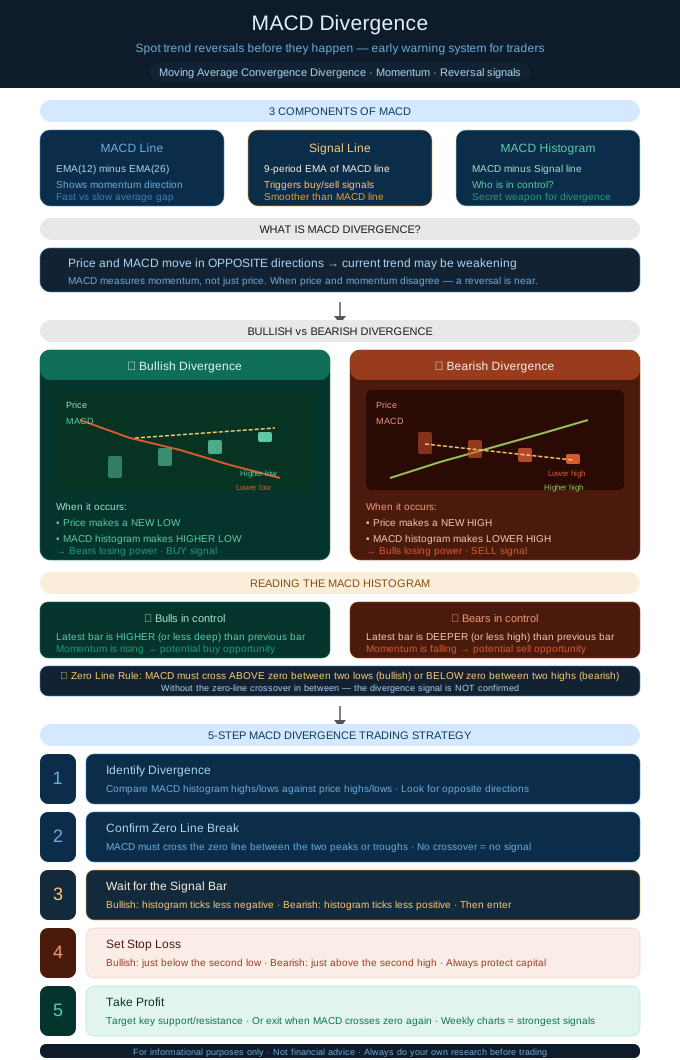
MACD Divergence Strategy
How to Trade MACD Divergence
Here’s an easy way to trade with MACD divergences that works well:
1. Identify Divergence
Check the MACD histogram’s highs and lows against the price highs and lows.
2. Confirm Zero Line Break
Make sure that the MACD line goes through the middle point of the two tops or bottoms.
3. Wait for the Signal Bar
When the MACD histogram ticks in the opposite direction (less negative for bullish, less positive for bearish), that’s when you should enter the market.
4. Set Stop Loss
If you’re bullish, it means just below the second low. If you’re bearish, it means just above the second high.
5. Take Profit
Target major support or resistance levels, or exit when the MACD crosses the zero line again.
A higher timeframe, like weekly charts, will give you stronger signals. Using a lower timeframe, such as daily charts, can assist you in determining the optimal timing for entering the market.
Final Thoughts
Guess what? Now you know why professional traders talk about momentum so much. MACD divergence is your early warning system; it lets you know when trends are losing steam before prices even change direction.
You can make better, more assured trading decisions if you wait for MACD to tick in your favor and confirm a true divergence.
Successful trading isn’t solely about predicting market movements. It requires accurately interpreting momentum, managing risk effectively, and responding quickly when conditions are advantageous.
FAQ
How accurate is MACD divergence?
There is a good chance that MACD divergence will happen, but it is not a sure thing. It is only as accurate as the market and the tools that confirm it. In rapidly trending markets, divergence can occur early, indicating that the price may continue moving in that direction for some time before reversing.
If you use MACD divergence with support and resistance zones, volume confirmation, or candlestick reversal patterns, you can be more sure of your predictions. When these things line up, divergence becomes a strong early warning system instead of just a hint.
What is the success rate of MACD divergence?
MACD divergence usually works between 60% and 75% of the time, depending on how disciplined you are. Traders who only look at divergence without confirmation are likely to be near the bottom of that range. With trendline breaks, volume spikes, or RSI divergence, on the other hand, your win rate can go up a lot.
Which timeframe is best for identifying divergence?
You can find MACD divergence on any time frame, but how you use it is what matters.
- For swing trading, higher timeframes—such as daily or 4-hour charts—provide signals that are generally stronger and more reliable.
- Once you see divergence on a higher chart, you can move down to a lower timeframe (15 minutes or 1 hour) to find exact entry points.
This top-down method makes sure that your entries line up with how the market is set up as a whole. This gives you accurate timing and confirmation of the trend.
Disclaimer
This post is just meant to give you information; it is not financial advice. Trading and investing are risky, and results from the past don’t always mean results in the future. People who want to invest or trade should do their research and think about their situation before making a decision. This content’s author and platform are not responsible for any damages or losses that happen because of its use. Get personalized help from a qualified financial expert.


