Have you ever considered comparing a digital currency price chart to another asset?
You’ve undoubtedly looked at stock and commodity charts before.
Examine any cryptocurrency price chart, whether for Bitcoin, Litecoin, Ethereum, or the rise and fall of any cryptocurrency. Is that similar to the patterns you see in stocks?
You can delve further into the price chart if you’d like. The volatility in the digital currency market can benefit both traders and investors. Let’s look at how it could become a capital for cryptocurrency traders and investors. What’s going on here? Look at this more closely.
Crypto trading profit
Please see the chart below. A monthly chart of Litecoin.
Please pay close attention to the boxes in the price chart. Investments have experienced numerous multipliers over time.
That is not to say that stocks or other assets never go through this. However, such volatility is common in the cryptocurrency market.

An asset’s long-term undervaluation can result in a price increase. The chart shows that every time the price fell after a big decline, there was a big rally.
Crypto price chart and profitable trading strategy
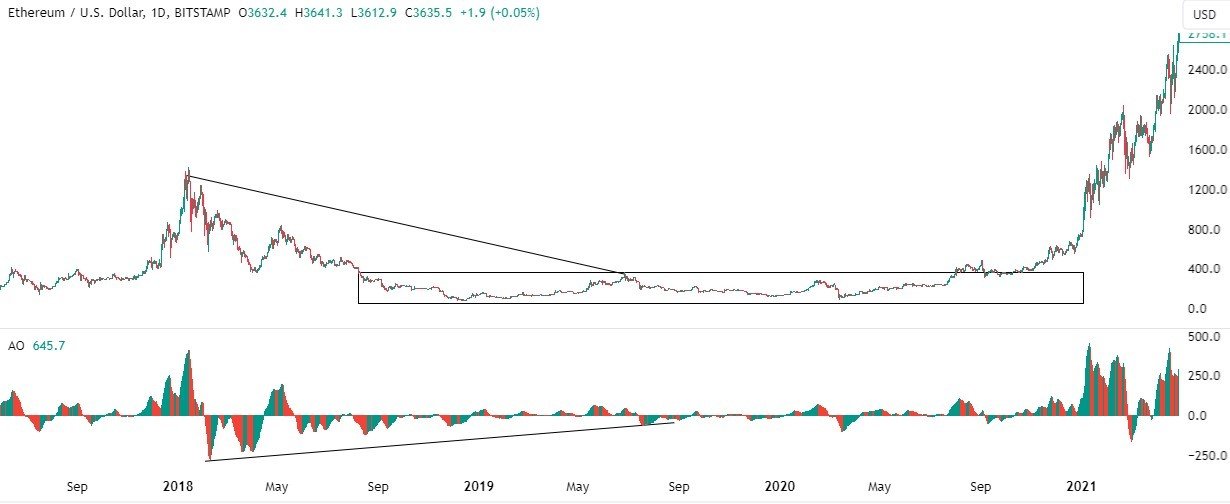
Let’s take a closer look at the price chart.
Price drops can frequently be seen from the top. In the latter case, track the price for an extended period of time as it moves around the almost same level.
Price divergences can also be seen here. Following this, the price exceeded the previous lower high point. This suggests a long-term increase in price.

A specific pattern appears on the chart prior to a significant price movement. This pattern is referred to as a motive wave in Elliott wave theory.
On a smaller scale, we look for an impulsive wave, which is a typical motive wave pattern on the chart.
Profitable trading strategy with Elliott Wave chart pattern
Let’s take a more in-depth look at the price chart.
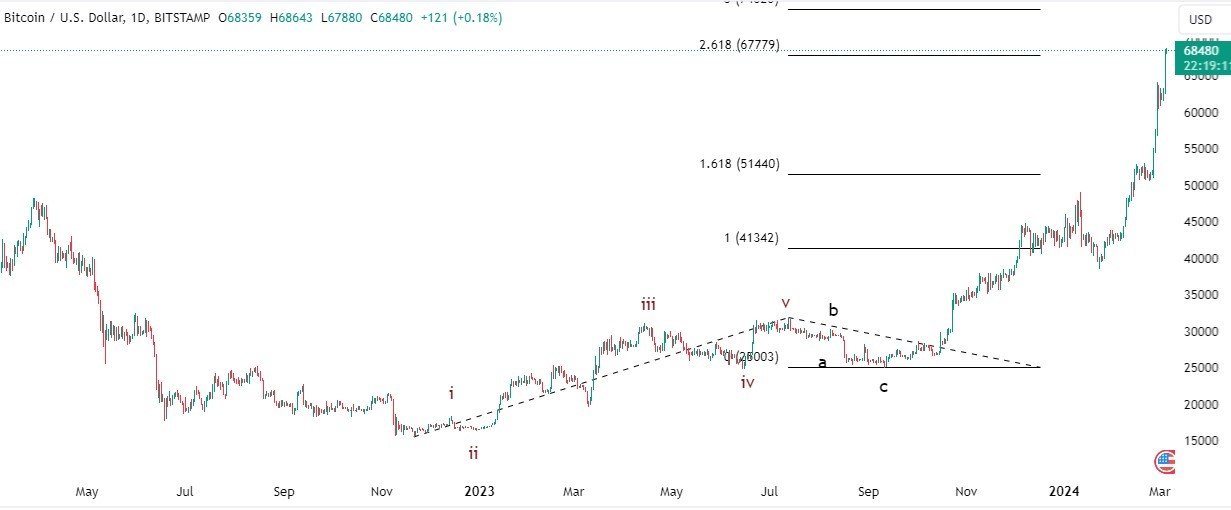
I am confident that you will notice the appearance of five waves, indicating a price increase. After a correction, a significant upward movement in price is visible. (Chart below)
You’ll be even more surprised as you get closer. Observe that the price increased by at least 161% after rising in the initial phase, surpassing that level in the subsequent phase. According to Fibonacci levels, it may exceed 261%, 361%, 461%, and other figures. In essence, after meeting all conditions, exercising some patience may result in reaching a predetermined target.
Trading in Impulse Wave
To find out if an Impulse pattern has developed after the lower-high crossover on the price chart, one must adhere to specific Elliott Wave principles.
First, Wave 2 should never drop below Wave 1’s starting point. Second, Wave 3 cannot be the shortest of the waves. Third, waves 2 and 4 on the price chart should not be at the same level. In other words, waves two and four should not overlap. Finally, one or more waves must be extended. This suggests that at least one wave between Waves 1, 3, and 5 should be extended, signifying a protracted upward or downward movement.

As can be seen from the example above, wave 3 is an extended wave. In comparison, waves 1 and 5 appear to be shorter.
In an extended wave, all sub-waves are typically visible. Waves 1, 3, and 5 exhibit distinct trends.
However, price corrections are evident in waves 2 and 4.
Price correction and trade entry
Following the formation of this impulse on a small scale, the price enters a corrective phase, typically retracing half of the distance between Waves 1 and 5. Frequently, after a 38% retracement, the price begins to rise, as shown in the chart above.
During this correction, it is best to wait patiently for the appropriate moment.
Profitable strategy in Crypto trading
When the price begins to move above the previous impulse near the end of the correction, clear opportunities appear on the chart.
You can also view the chart of another cryptocurrency or a different timeframe. I’m confident you’ll find similar profit opportunities there.
The profit potential is straightforward in this case. Following a market reversal, measuring the distance of the first impulse can be used as a benchmark for future growth. When this distance is set to 100%, it means that the price movement after the correction may be at least 161%. Following this, the price typically follows the Fibonacci sequence.
In the Elliott wave, this particular pattern is easily recognized.
It begins with a period of below-level reversals. Then there’s the impulse. Significant profits can be expected if the impulse’s conditions are met.
Patience game and trading
In the world of cryptocurrency investing, the Elliott Wave strategy, a powerful analytical tool, emphasizes patience. To be successful with this strategy, you must wait for distinct wave patterns to form, which mirrors the disciplined approach to holding positions during market fluctuations.
The key is to recognize that each wave has its own timeline, requiring patience to determine the best entry and exit points. Booking profits occurs at the end of a full wave cycle, emphasizing strategic and measured patience in order to align with the Elliott Wave theory’s rhythmic patterns.
Final thoughts
Finally, the Elliott Wave strategy emerges as an appealing option for cryptocurrency investors seeking a refined and systematic approach. Based on wave patterns and market psychology, it offers a structured decision-making framework.
Patience, an important component of this strategy, is useful for capitalizing on market cycles and determining entry and exit points. Understanding and applying Elliott Wave theory enables investors to navigate the volatile crypto landscape with greater precision, encouraging a strategic and disciplined approach to cryptocurrency investment.
Disclaimer
This article is provided for informational purposes only and does not offer financial advice. Trading and investing involve risk, and past performance is not a guarantee of future outcomes. Before making investment decisions, readers should conduct their own research and consider their individual circumstances. The author and platform are not responsible for any financial losses or damages resulting from the use of this information. Get personalized advice from a trained financial counselor.


