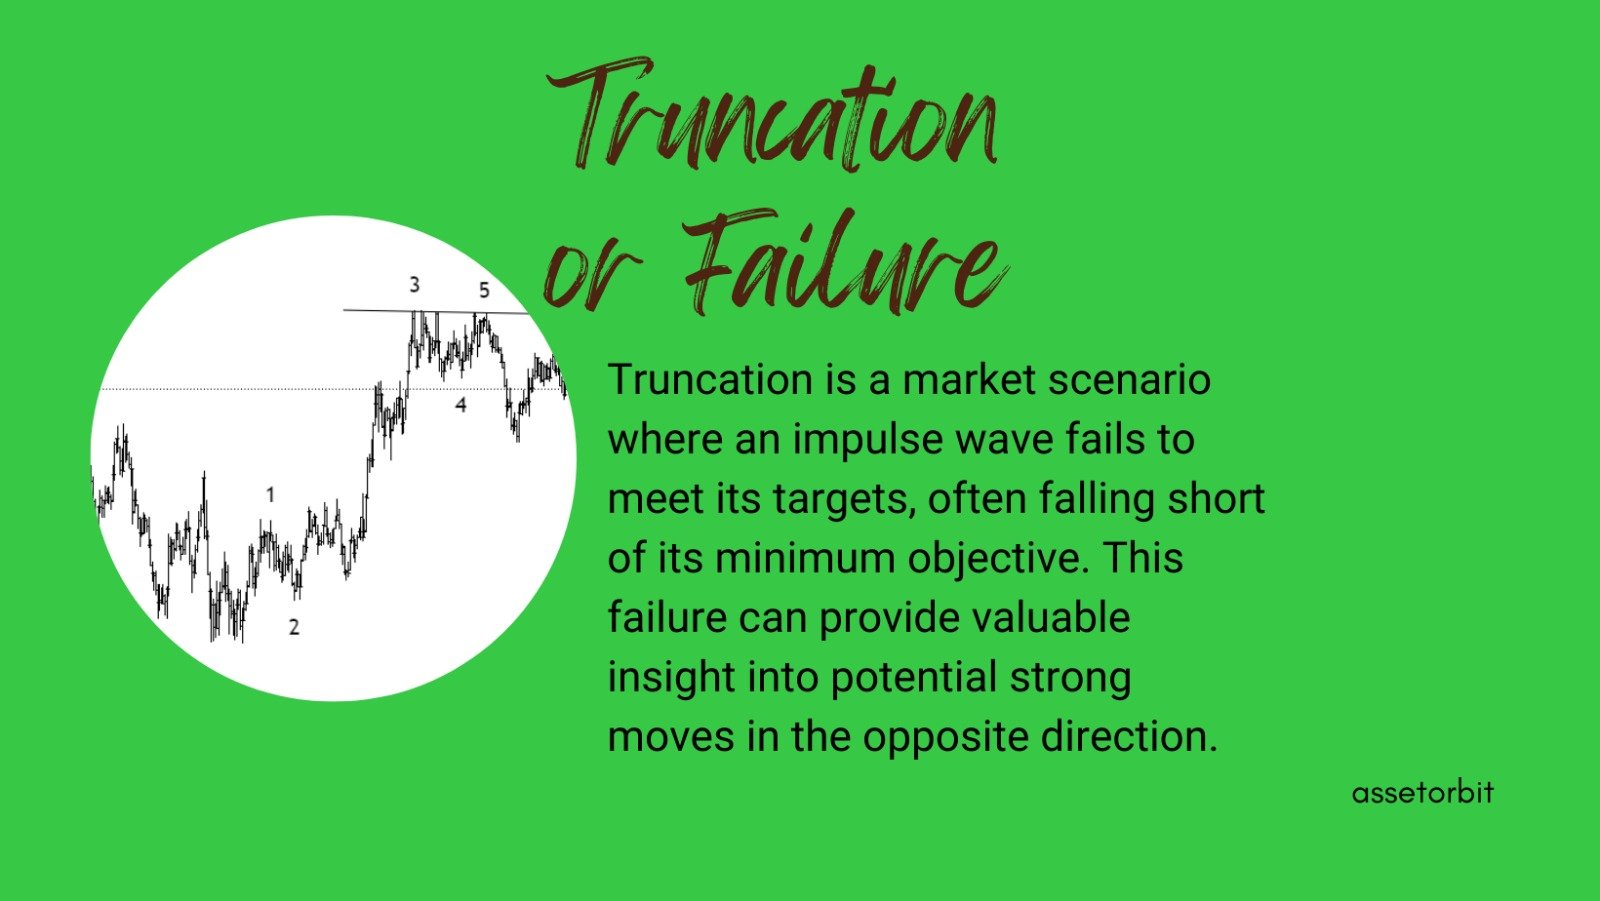
Truncation or Failure in Impulse
Truncation, or failure in impulse, is a market scenario where an impulse wave fails to meet its anticipated targets. A failure occurs when an impulse wave weakens and fails to reach its minimum objective. The fifth wave typically occurs when it falls short of the third wave‘s endpoint. A failed fifth wave provides valuable insight into the potential for a strong move in the opposite direction. Traders often overlook failures or hope they’re just wave 1 within a potentially extended fifth wave, highlighting the challenges and uncertainties in predicting market movements.

What is a truncated wave?
A truncated wave is a distinctive occurrence within Elliott Wave Theory used in trading. The fifth wave typically extends beyond the peak of the third wave in a series of market impulses. In some instances, the fifth wave fails to reach the extremum of the third wave. This particular situation is known as truncation, or a truncated wave. The final wave does not fully complete its anticipated trajectory, resembling a twist in the expected pattern.
Truncated waveform guideline
Truncation means that the anticipated wave’s fifth wave’s extension is limited, resulting in a waveform that falls short of the anticipated levels based on previous wave progression. Traders and analysts closely monitor this phenomenon, as it may indicate momentum loss and potentially lead to a market reversal.
In Elliott Wave Theory, a truncated waveform in the fifth wave carries dual significance for traders and analysts. Firstly, it can pose a trap for traders seeking profits, as the failure of the fifth wave to reach the expected extremes might result in unexpected losses. Hence, caution is crucial. Secondly, the occurrence of truncation at the end of a trend indicates a potential reversal. The market’s dynamics indicate a shift in direction, with prices indicating a reverse direction following the countdown. Accurate entries and profit-taking are essential for successful navigation in this scenario. Traders in truncated waves must be vigilant to avoid misinterpretation of sub wave 1 of Wave 5, requiring careful consideration at the end of any motive wave.
Truncated pattern examples
Elliott Wave Theory presents unique patterns in truncated examples. A common occurrence is when the fifth wave fails to surpass the extreme set by the third wave, extending the previous motive wave.

Truncation is often observed when the third wave is extended, which contributes to the overall shape of the truncated fifth wave. The pattern suggests that Wave 1 and Wave 5 are often observed to have almost the same length. When the waves share similar lengths, it is often a sign of a truncated fifth wave.
Final thoughts
Truncation is a crucial concept in Elliott Wave Theory, where the fifth wave in an impulsive pattern falls short of the price extreme set by the third wave. Understanding truncation provides valuable insights for market participants, such as the extension of the previous motive wave and the similar lengths of Wave 1 and Wave 5. Recognizing these patterns is essential for making informed trading decisions and anticipating potential market shifts. Traders should remain vigilant and use these principles to navigate wave analysis for more accurate predictions.
FAQs
Can wave 5 be truncated?
Elliott Wave Theory acknowledges the possibility of wave 5 being truncated, which occurs when the fifth wave fails to surpass the price extreme set by the third wave. This indicates a potential loss of momentum in the trend and is crucial for traders and analysts. Recognizing a truncated wave 5 is significant for Elliott Wave analysis, as it may signal a reversal or shift in market dynamics. Identifying and interpreting such patterns helps traders make informed decisions and adjust their strategies.
How do you calculate truncation?
Calculating truncation in Elliott Wave Theory is not based on numerical computations but involves a qualitative assessment of wave patterns. Truncation occurs when the fifth wave in an impulsive pattern falls short of the price extreme set by the third wave. Traders identify this phenomenon by visually inspecting the price chart and comparing the heights of the third and fifth waves. Elliott Wave analysis is crucial for traders as it identifies potential trends’ weaknesses and aids in predicting market reversals.
What are the signs of truncation?
Elliott Wave Theory identifies signs of truncation by observing the relationship between the third and fifth waves within an impulsive pattern. The primary indicator is the fifth wave’s failure to surpass the price extreme set by the third wave. Traders and analysts look for visual cues in the price chart, such as a short expected upward or downward extension in the fifth wave. Identifying these signs is crucial for market participants, providing insights into potential trends and weaknesses, allowing informed decisions, and anticipating market reversals.
Chart Source: tradingview.com
Disclaimer
This article is provided for informational purposes only and does not offer financial advice. Trading and investing involve risk, and past performance is not a guarantee of future outcomes. Before making investment decisions, readers should conduct their own research and consider their individual circumstances. The author and platform are not responsible for any financial losses or damages resulting from the use of this information. Get personalized advice from a trained financial counselor.


