Welcome to the exciting world of Elliott Wave Theory, where the Zig-Zag correction takes center stage as the first pattern of the corrective phase. Due to its internal simplicity, it is the easiest form of correction to grasp for many traders. The corrective pattern is designed using a simple three-wave structure, specifically labeled as A-B-C. In this post, we’ll analyze the rules, guidelines, and specific patterns that define the Zig-Zag correction, demystifying its seemingly complex nature and equipping both seasoned traders and novices with the tools they need to accurately read market moves.
In short
What is Zig-Zag correction?
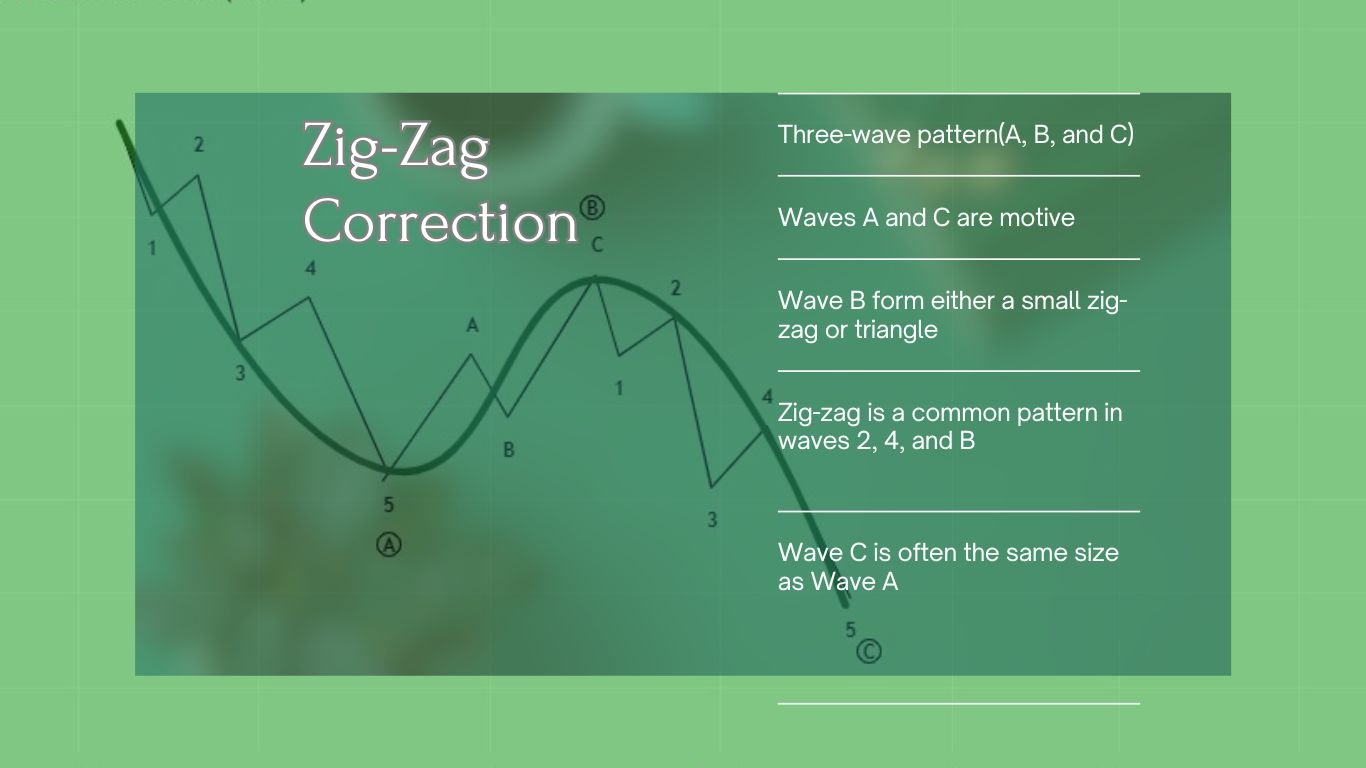
Zig-Zag correction follows a 3-wave structure labeled A, B, and C. Waves A and C are motive, following a 5-3-5-3-5 pattern. Typically, A and C form an impulse wave, moving opposite the main trend. Wave B, another correction, moves in the main trend direction with three smaller waves, shaping either a small Zig-Zag or a triangle with a 3-3-3-3-3 structure.

Characteristics of Zig-Zag correction
- Three-wave pattern labeled A, B, and C.
- Waves A and C within the Zig-Zag correction are motive and follow a 5-3-5-3-5 structure.
- Waves A and C move in the opposite direction of the main trend.
- Wave B correction by three smaller waves can form either a small zig-zag(5-3-5) or a triangle(3-3-3-3-3) structure.
- A zig-zag correction is a common pattern found in waves 2, 4, and B.
- Wave C is often the same size as Wave A.
Rules for Zig-Zag patterns
Rule 1 # Wave B must end before the starting point of Wave A.
Rule 2 # Wave C must terminate cross the end of wave A.
Rule 3 # Waves A and C are the motive, while wave B is the corrective.
Rule 4 # Wave A is always an impulse or a leading diagonal.
Rule 5 # Wave C is always an impulse or an ending diagonal.
Conclusion
Zig-Zag Correction is a powerful tool for traders to navigate financial markets. Its three-wave structure, labeled A, B, and C, provides valuable insights into potential trend reversals and continuations. Understanding the motive nature of waves A and C, impulse wave formation, and the corrective nature of wave B can enhance traders’ decision-making processes. Mastering zig-zag correction can be a game-changer, empowering traders to ride market fluctuations with confidence and precision. Whether seasoned or a newcomer, armed with these insights, traders can make informed and strategic trading decisions.
FAQs
What is the most common form of corrections?
The Zig-Zag correction is the most common form of correction in Elliott Wave Theory. It has a simple three-wave structure labeled A, B, and C, with waves A and C being motive in character and often forming an impulse. Zig-zag corrections are common in financial markets and are frequently connected with transitory countertrend movements within the broader price trend.
Chart Source: tradingview.com
Disclaimer
This article is provided for informational purposes only and does not offer financial advice. Trading and investing involve risk, and past performance is not a guarantee of future outcomes. Before making investment decisions, readers should conduct their own research and consider their individual circumstances. The author and platform are not responsible for any financial losses or damages resulting from the use of this information. Get personalized advice from a trained financial counselor.


