




Here’s something most traders won’t tell you: the next market move isn’t always as complicated as you think. Occasionally the market almost gives you an idea of where it’s going, if you know what to look for. And when you are able to read that signal, selling options becomes a much more confident, structured act. In this column, I want to walk you through how I determine market direction before I enter into an options-selling trade. Two steps. A clear procedure. No guessing.
Why Market Direction Matters for Option Sellers
In previous columns, I discussed strike selection and the importance of time decay. But first, you need to know which way the market will move. If I expect prices to rise, I will sell a put option. If I expect prices to fall, I sell a call. This is the foundation; get the direction right, and everything else works with you, not against you.
The Same Strategy Works Across All Markets
While I focus on Nifty and Bank Nifty index options, the directional framework I use applies universally. Stock options, commodity options, and crypto options: the principle is identical. Wherever there is a price chart and an oscillator, this method works. The instrument changes; the logic does not.
Step 1: Locate the Point of Difference
My first indicator is divergence between price and an oscillator. A divergence occurs when price and momentum are moving in opposite directions, and it is one of the clearest early warnings that a trend reversal is coming.
Which Oscillators I Use
I primarily use three oscillators: the Awesome Oscillator (AO), MACD, and RSI. These are the oscillators I prefer, but many others work similarly. I analyze the Awesome Oscillator on a 15-minute timeframe, though the same logic applies to any time frame. A longer timeframe simply means a longer trade horizon.
How to Read a Divergence
The setup is straightforward. If the market is making higher highs while the oscillator is making lower highs, that is a bearish divergence; the upward momentum is weakening even though price is still rising. The market is losing momentum. Conversely, if the market is making lower lows while the oscillator is making higher lows, that is a bullish divergence; the selling pressure is exhausting itself.

I refrain from immediately entering the market upon spotting a divergence. I treat it as an alert, not a trigger. The trigger comes in step two.
Divergence Signals: What They Mean and How I Respond
| Market Price | Oscillator Reading | Signal | My Action |
| Rising (higher highs) | Falling (lower highs) | Bearish Divergence | Prepare to sell a call. |
| Falling (lower lows) | Rising (higher lows) | Bullish Divergence | Prepare to sell a put. |
| Rising steadily | Rising steadily | No divergence | Wait, no signal yet |
| Falling steadily | Falling steadily | No divergence | Wait, no signal yet |
Step 2: Draw the Trendline and Wait For the Break
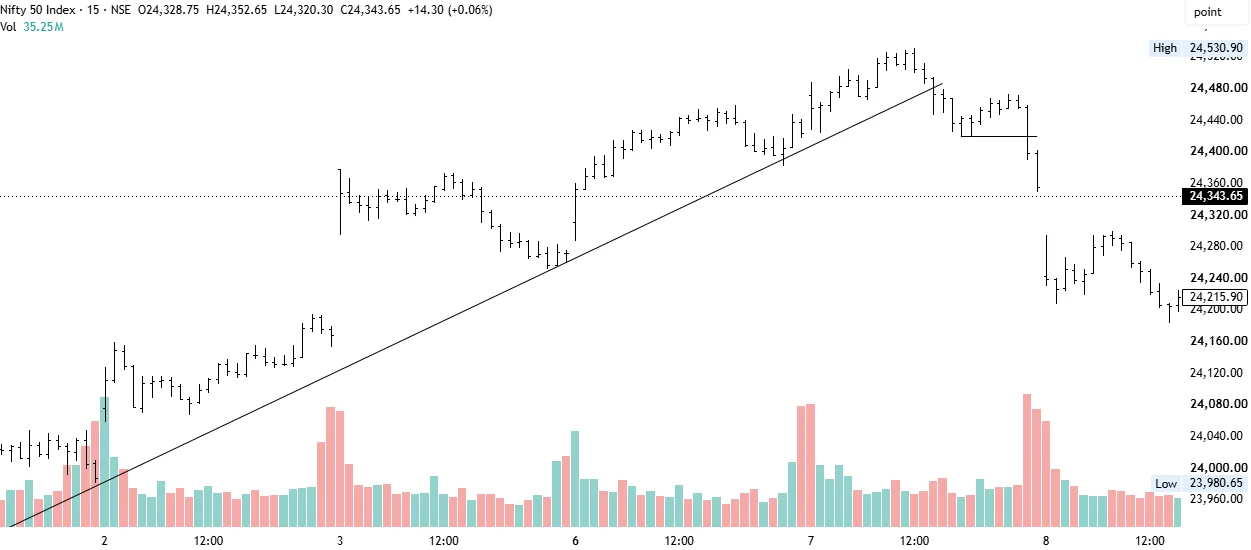
When I confirm a divergence, I draw a trend line through the latest price highs or lows depending on which way it is going. This part is not complicated; connecting two or more significant peaks or troughs gives you a clear structural line that the market must break to confirm the reversal.
The Hardest Part: Doing Nothing
After drawing the trendline, I wait. I do nothing. And this, truly, is where most traders fail. Jesse Livermore articulated it better than anyone: true wealth is achieved through patience and steadfastness. Not by reacting to every tick. Not by entering early. The key is to wait for the market to confirm what the divergence has already suggested.
The process is to spot the divergence, draw a trendline, and then wait for the price to break it. When it does, the first part of the reversal is underway. But I still do not enter immediately.
The Volume Confirmation: The Final Trigger
After the trendline breaks, the market typically retraces, pulling back slightly before continuing in the new direction. My actual entry trigger is when the price breaks the prior low (or high) on volume after the retracement. That volume-backed break is my confirmation. The pattern is now complete. The signal is clean. That is when I look at options.
Checking the Options Premium Chart Before Entry
Even if the direction Even if the index chart confirms the direction, I take one more step before executing. On the index chart, I take one more step before I execute. I pull up the premium chart for that particular option I want to sell and make sure it is what I think it is.
What I Am Looking For
If I am selling a call because I expect the market to fall, the call premium chart should ideally already be showing signs of declining. A clear downward trend on the premium chart tells me that the market agrees with my thesis, that sellers are in control of that option, and that time and direction are both working in my favor. If the premium chart looks choppy or contradictory, I wait.
This double-check takes sixty seconds. It has saved me from entering trades that looked right on the index chart but were showing warning signs in the premium. Always verify both.
Selling the Right Option: Call or Put?
Once direction is confirmed and the premium chart checks out, the option type is straightforward:
A rising market is expected; sell a put option. The Put will lose value as the market moves up, and time decay accelerates that loss.
In a falling market, sell a call option. The call will lose value as the market declines, and the premium erodes quickly, particularly in a sharp move down, as Livermore repeatedly observed.
The stop-loss is defined before the trade is placed. Always. Even with a confirmed divergence, a trendline break, volume confirmation, and a clean premium chart, the market can still surprise you. The stop-loss is not a sign of doubt. It is the structure that keeps a losing trade manageable.
Full Entry Checklist: Run This Before Every Directional Trade
Before I place any option-selling trade based on this directional method, I run through all of the following steps. Every essential item must pass. If any one of them fails, I do not enter.
| # | Step | What to Do | Priority |
| 1 | Spot the Divergence | Identify price vs oscillator divergence on 15-min chart (AO, MACD, or RSI) | Essential |
| 2 | Draw the Trendline | Connect recent highs or lows to form a clear trendline | Essential |
| 3 | Wait for a Trendline Break | Do not act until price breaks the trendline; patience is the edge | Essential |
| 4 | Confirm with Volume | After retracement, watch for a new low/high break accompanied by volume | Essential |
| 5 | Check the Options Premium Chart | Verify the premium chart reflects the expected directional move | Essential |
| 6 | Select the Right Strike | OTM but meaningful premium, not deep OTM worthless options | Essential |
| 7 | Confirm Expiry Date | Minimum 3–4 weeks away for time decay to work | Important |
| 8 | Set Stop-Loss Before Entry | Define your stop-loss level before placing the trade | Essential |
| 9 | Sell the Correct Option Type | Rising market: sell a put. Falling market: sell Call | Essential |
| 10 | Review and Execute | Final check on all above, then and only then, enter the trade | Important |
Final Thought
Predicting market direction does not require a PhD in finance or a screen full of indicators. It requires patience, a clear process, and the discipline to wait for confirmation before acting. Divergence tells you something is changing. The trendline break tells you it has begun. The volume confirmation tells you it is real. And the premium chart tells you the options market agrees.
Two steps. One spot check. One trade. This is the way. Wait for the pieces to fall into place and then act with conviction. The market rewards those who wait for clarity and not those who chase noise.
Find out here: How to Select Strike Price for Option Selling: Don’t Sell Worthless Options
Disclaimer: This column reflects the author’s personal trading experience and analysis. It is not financial advice. Please consult a registered advisor before making any investment decisions.

Satyajit Baidya
He is an option writer who came to the markets through curiosity and stayed through conviction. He studies price action through the lens of Elliott Wave theory and draws his trading philosophy from Jesse Livermore—the belief that discipline, timing, and patience matter more than predictions do. A student of history by training, he sees the market as just another chapter in a very long story: the details change, the patterns don’t.