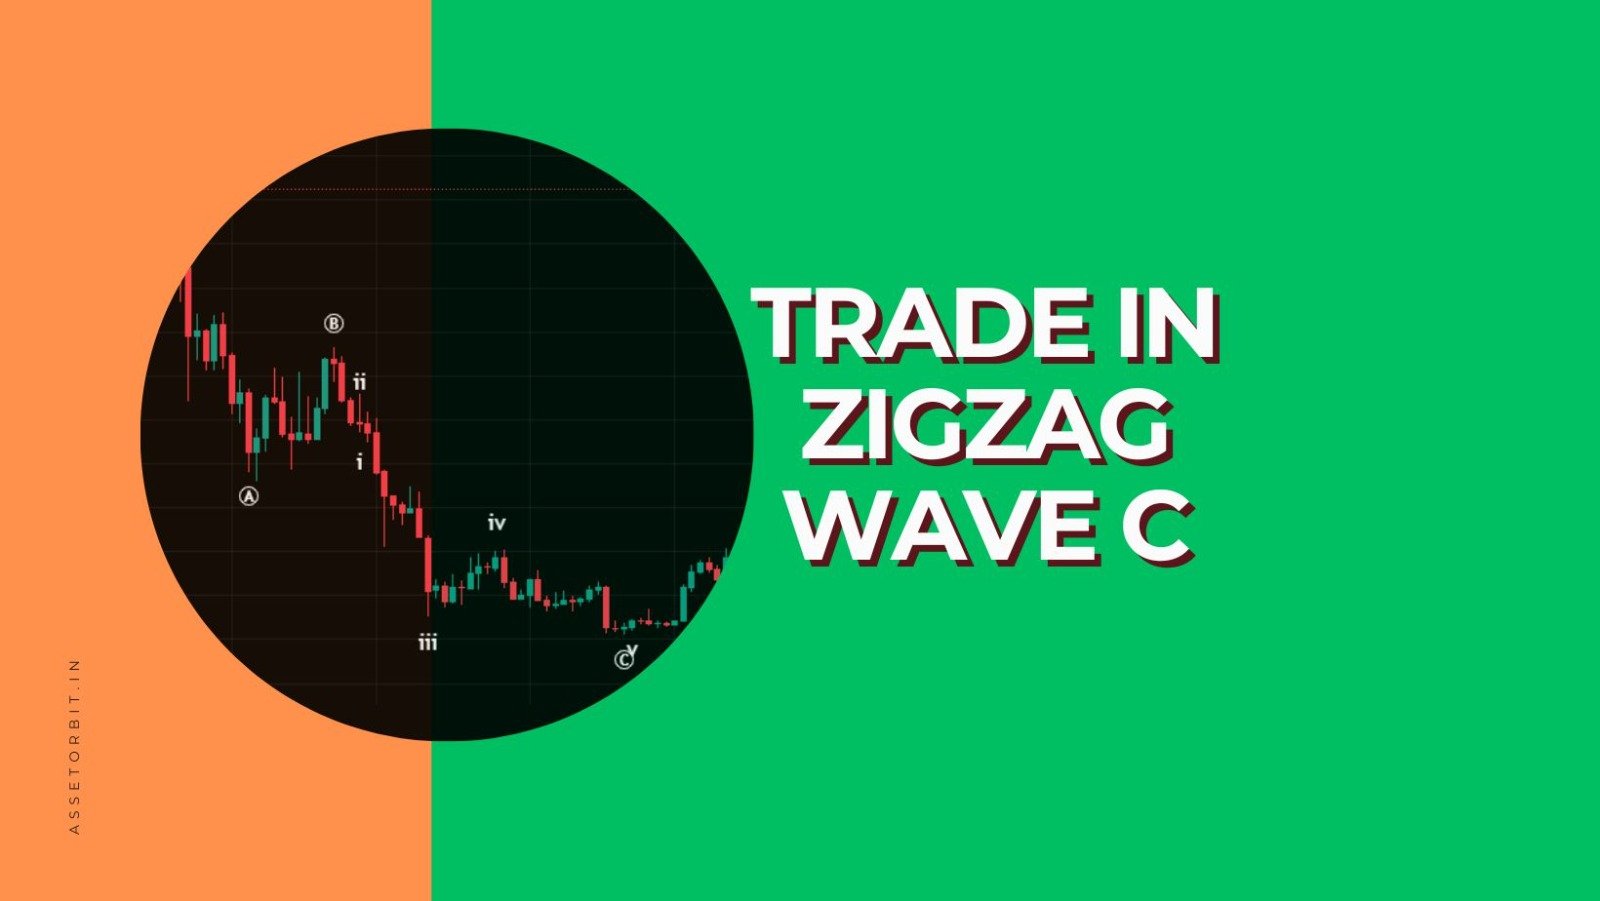
Wave c in zigzag
Based on Elliott Wave Theory, a correction occurs after a motive phase, with the initial signs of a Zigzag correction identified. Wave A of a Zigzag will always consist of five sub waves. Spotting three sub waves after the five in wave A, generating wave B, means that wave C will naturally follow with another set of five sub waves. This pattern—five sub waves in A, three in B, and then five in C—represents a complete zigzag correction. Wave C’s impulse provides an easy trading opportunity because this predictable pattern helps traders forecast the market’s direction, allowing them to profit from the movement signaled by these sequences.
In short
Zigzag corrective wave
The Zigzag corrective pattern features a simple 5-3-5 repetition. Once the market has completed the initial 5–3 phase, you can easily enter trades during the subsequent set of five sub waves. The pattern comprises a five-wave movement, a brief three-wave countertrend, and a further five-wave advance in the original direction. It provides traders with a clear opportunity to forecast market movements and make decisions based on the expected completion of the last five-wave section.

C wave correction in Zigzag
The C wave correction in the Zigzag pattern is a natural impulsive pattern. It has all of the conditions commonly found in an impulsive wave. It may also include a large rally.
In an Impulse, the aim for Wave 3 is usually set to be at least 161% of the length of Wave 1. This projection implies that Wave 3 frequently exceeds the length of Wave 1, demonstrating the wave’s significant momentum and trend acceleration within the Elliott Wave pattern.
How to trade in wave C in zigzag
Analyzing chart
As we examine trading in Wave C within a Zigzag correction, we will look at the Bitcoin chart below. It is possible that Wave B may end in March 2022. Then the focus changes to whether sub wave 1 of wave C occurred or not.
When trying to find a trade opportunity, you always begin by asking yourself one basic question: ‘Do I recognize Wave 1‘? If the answer is yes, it’s time to look further into the price chart. If the answer is no, it’s time to quickly move to a different chart.
In the Bitcoin chart, from mid-to-late April 2022, a flat correction in sub wave 2 is observable. Wave 2 ended at 43343.

Trading plan
A trade entry should be considered when the Wave 2 correction retraces between 38 and 50 percent(Fibonacci Levels) of Wave 1. To confirm, shorting could be done if the price crosses Wave 1’s level. In this scenario, shortly after Wave 2’s correction, the price quickly crossed Wave 1’s level of 39918.
The target is simple: at least 161 percent. On the price chart, it is at 28586. The price quickly met and reached its target.
Risk management
If an entry is taken at the retracement of Wave 2, the initial stop loss could be placed at the starting point of Wave 1, which would be at 47995. If the price reaches the lowest point of Wave 1, which is 53343 points on the chart, the stop loss may be trailed at the end of Wave 2. Similarly, trailing stop losses could be used to correct Wave 3’s sub waves 2 and 4. In such circumstances, being patient could result in enormous profit opportunities.
Target of wave C
In Elliott Wave Theory, the target for Wave C frequently follows the principle of equal length with Wave A, indicating that Wave C may travel a comparable distance as Wave A. Alternatively, traders may consider Wave A’s 127% prediction as the next likely objective for Wave C.
Identifying the minimum target for Wave C allows us to readily spot profitable positions on the chart. This enables us to anticipate probable price fluctuations and tactically book profits using the Elliott Wave methodology.
Final thoughts
Identifying wave patterns and prospective targets allows traders to properly discover profitable opportunities and negotiate the complexities of market movements. Traders can enhance their trading success within the Zigzag corrective framework by conducting thorough analysis and making strategic decisions on Wave C movements.
FAQs
What is the target of wave C?
The target of Wave C in Elliott Wave Theory is determined by the principle of equality in length between Wave C and Wave A, implying that Wave C is expected to reach a similar distance. Alternatively, another target considered is the 127 percent projection of Wave A. These factors determine the potential length of Wave C within the Elliott Wave pattern.
Can wave C be longer than wave A?
Yes, Wave C can go beyond the length of Wave A in Zigzag correction. While the principle of equality in length suggests that Wave C frequently matches the distance covered by Wave A, market dynamics may sometimes cause Wave C to exceed Wave A in length. Market emotion, fundamental changes, and unforeseen occurrences may all contribute to Wave C's elongation, emphasizing the fluid nature of market movements within the Elliott Wave framework.
Chart source: tradingview.com
Disclaimer
This article is provided for informational purposes only and does not offer financial advice. Trading and investing involve risk, and past performance is not a guarantee of future outcomes. Before making investment decisions, readers should conduct their own research and consider their individual circumstances. The author and platform are not responsible for any financial losses or damages resulting from the use of this information. Get personalized advice from a trained financial counselor.


